
2022 & 2023 San Antonio Market Statistics for Rental Properties
These statistics are compiled by Hendricks Property Management from LERA MLS® and used for informational purposes only. SABOR MLS® has not verified the accuracy of these statistics. Check out our most current rental statistics.
Table of Contents
Last published January 1, 2024
Introduction
This archive covers the San Antonio rental market from August 2022 through December 2023. For this year's numbers, see the current San Antonio rental market report.
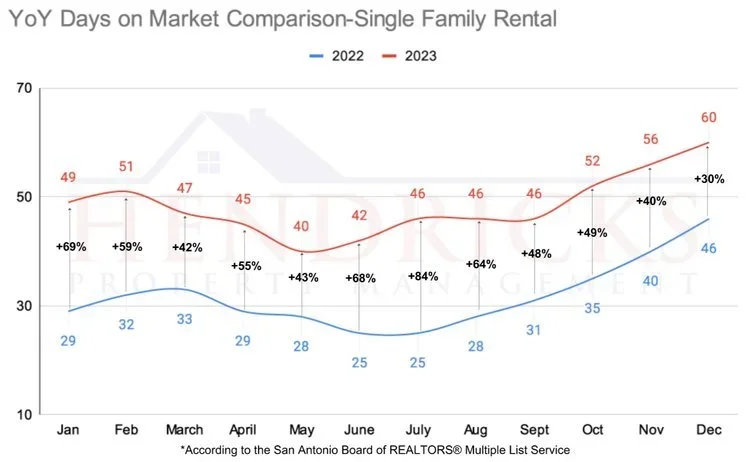
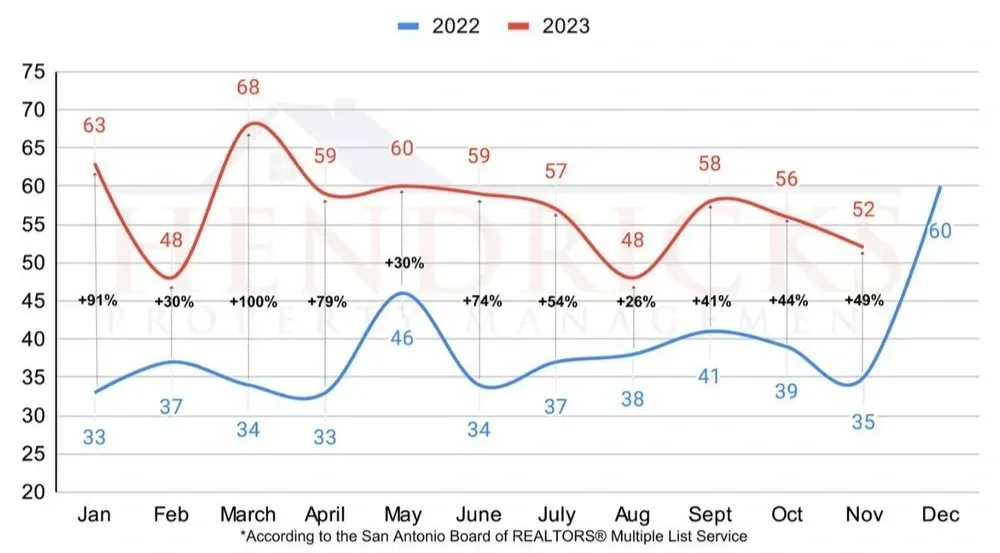
These two years tell one story. In 2022, homes rented fast. The average single family rental spent about 32 days on market, and months of inventory dropped as low as 1.8 in May and June. By 2023, that same home took about 48 days to rent, roughly 50% longer. Rents stayed close to flat the whole time.
2022 vs. 2023 at a Glance
| 2022 vs. 2023 at a glance | 2022 | 2023 |
|---|---|---|
| Avg. single family days on market (monthly avg.) | 32 | 48 |
| Fastest month (days on market) | 25, June and July | 40, May |
| Slowest month (days on market) | 46, December | 60, December |
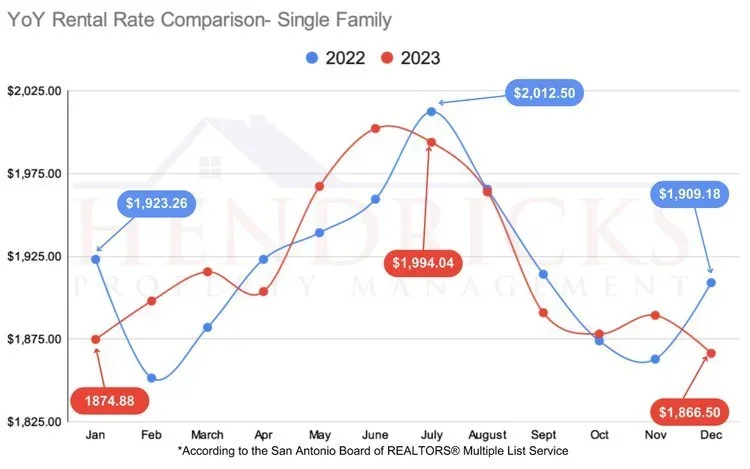
| Single family rental rate, December | $1,909 | $1,867 |
December 2023 Overall Market Statistics
643 single family homes rented in December at an average of $1,865, against an average list price of $1,977. Homes took 60 days to rent, 30% longer than December 2022. Inventory finished the year at 3.4 months.
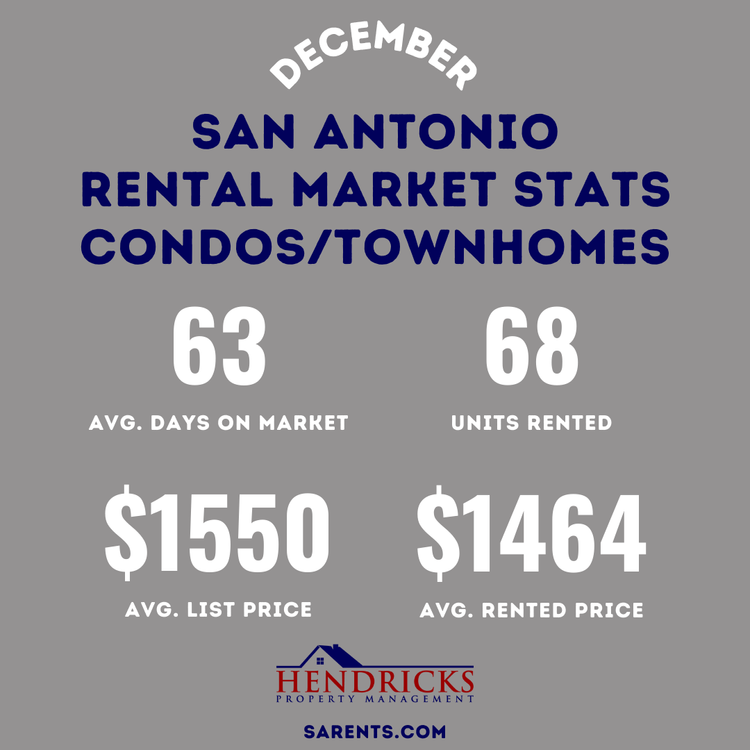
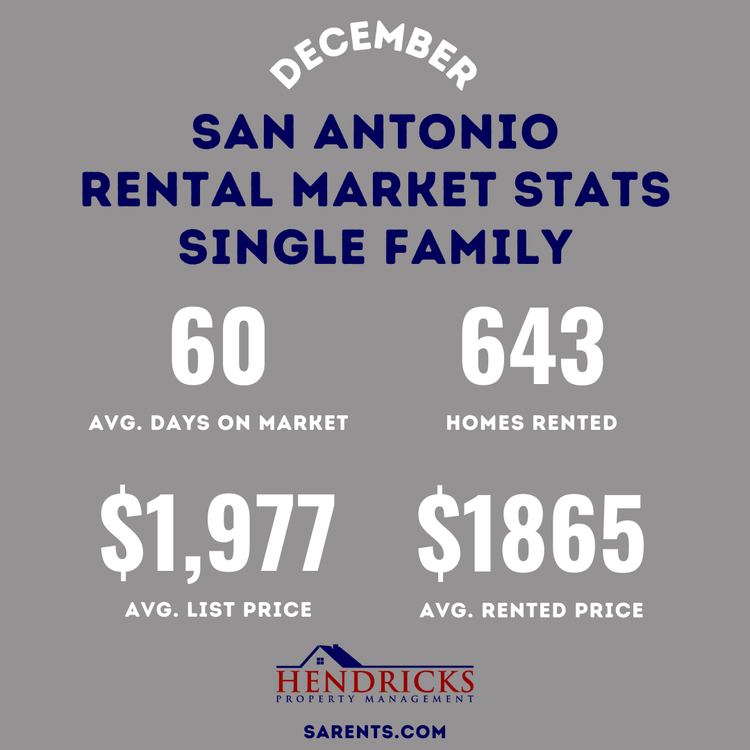
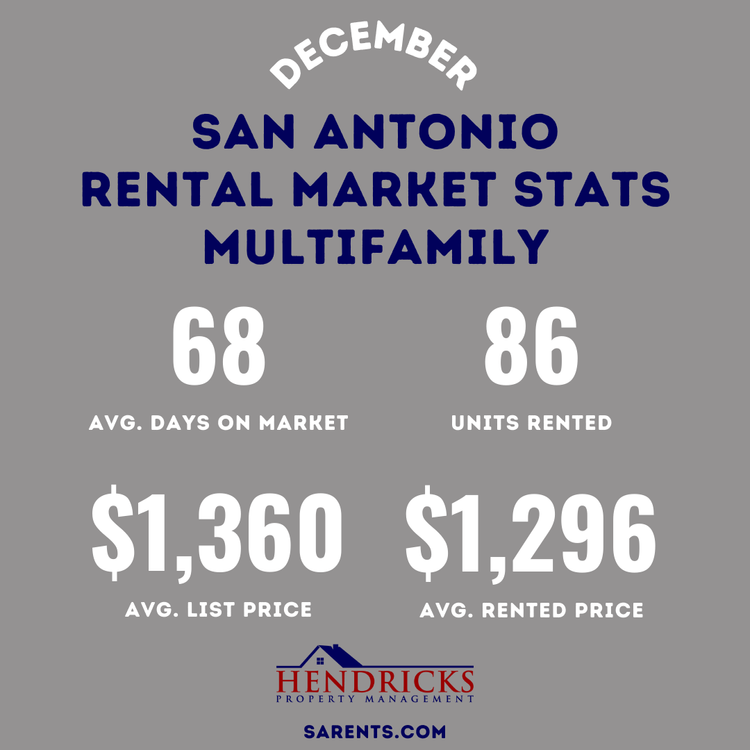
Days on Market and Rental Rate Comparisons for Single Family, Multifamily, and Condos or Townhomes
November 2023 Overall Market Statistics
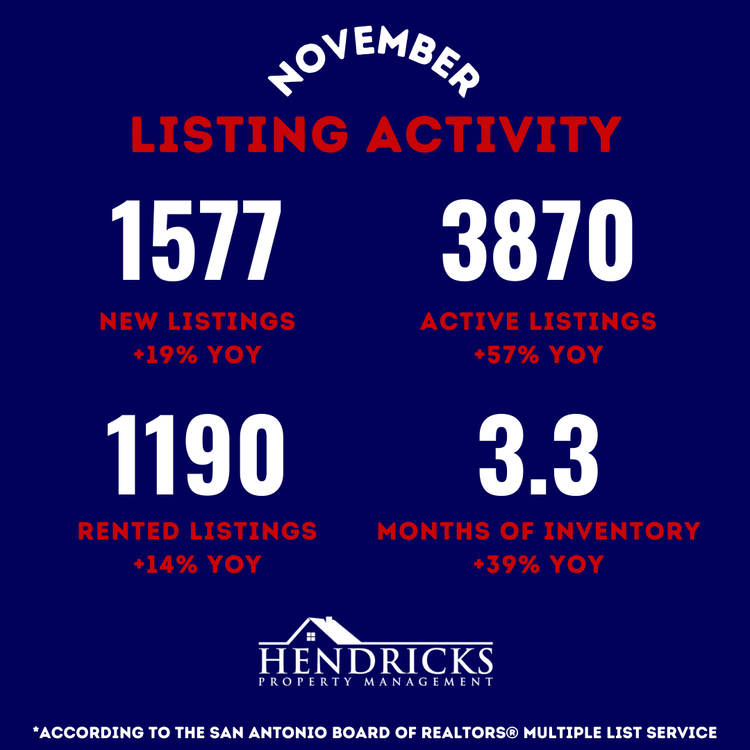
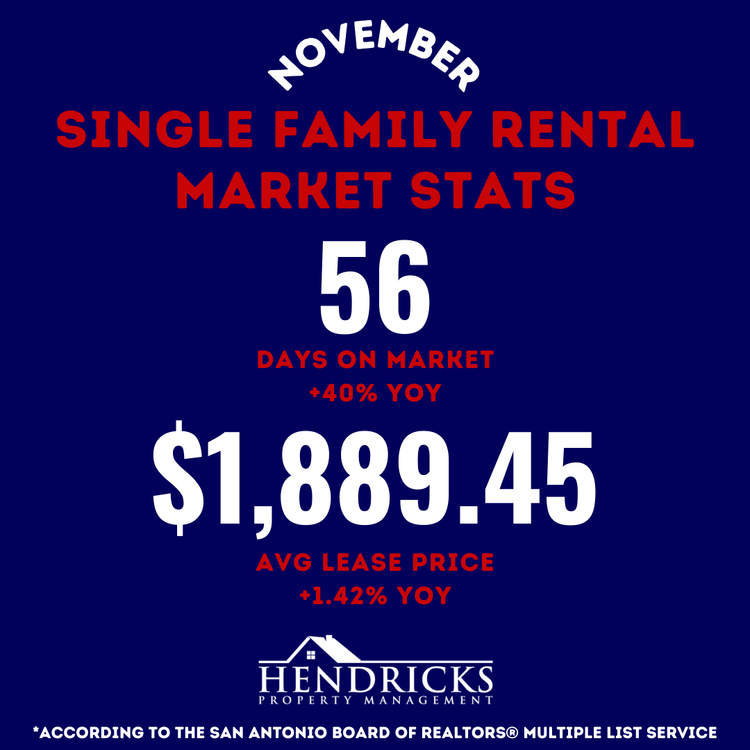
The average single family rental rate was $1,889. Days on market hit 56, 40% slower than November 2022's 40 days. Inventory dipped to 3.3 months.
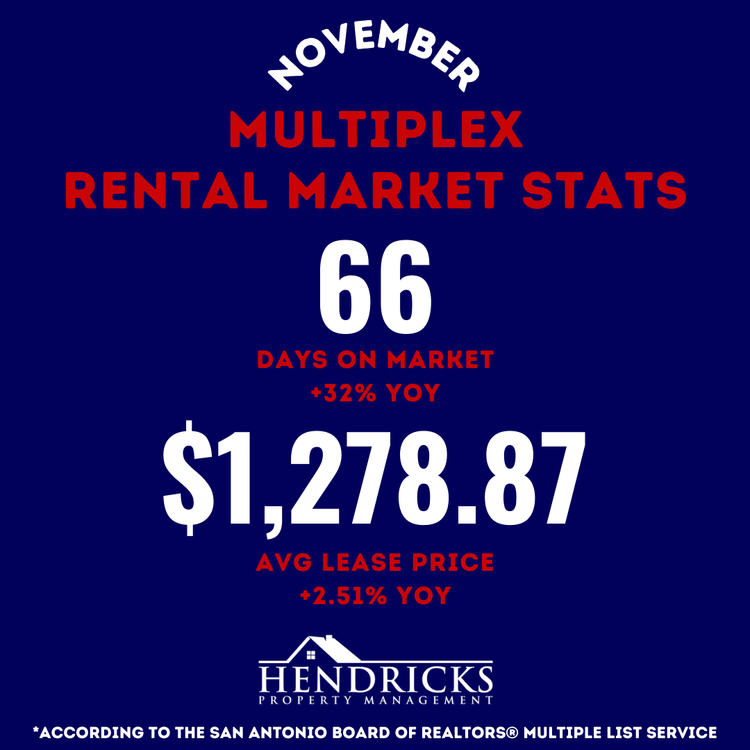
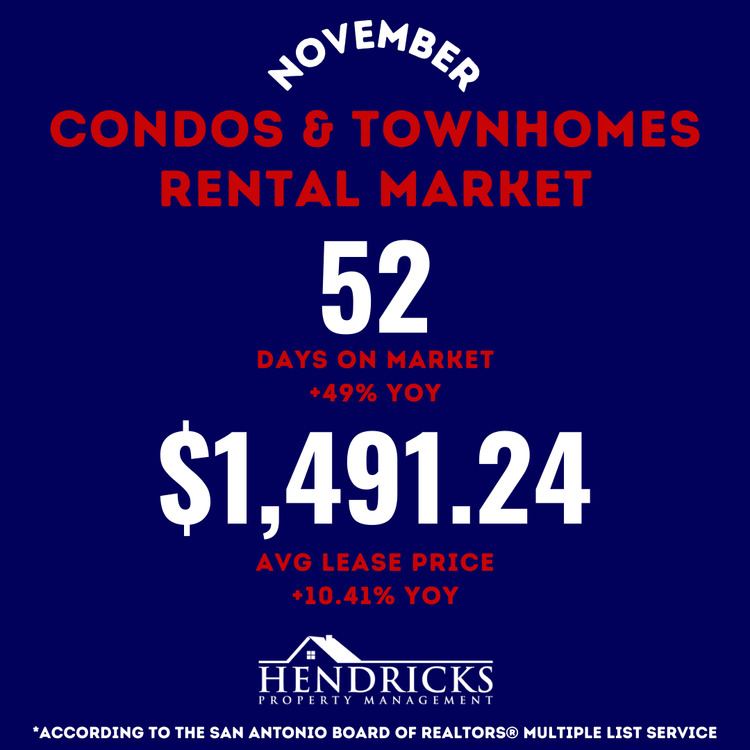
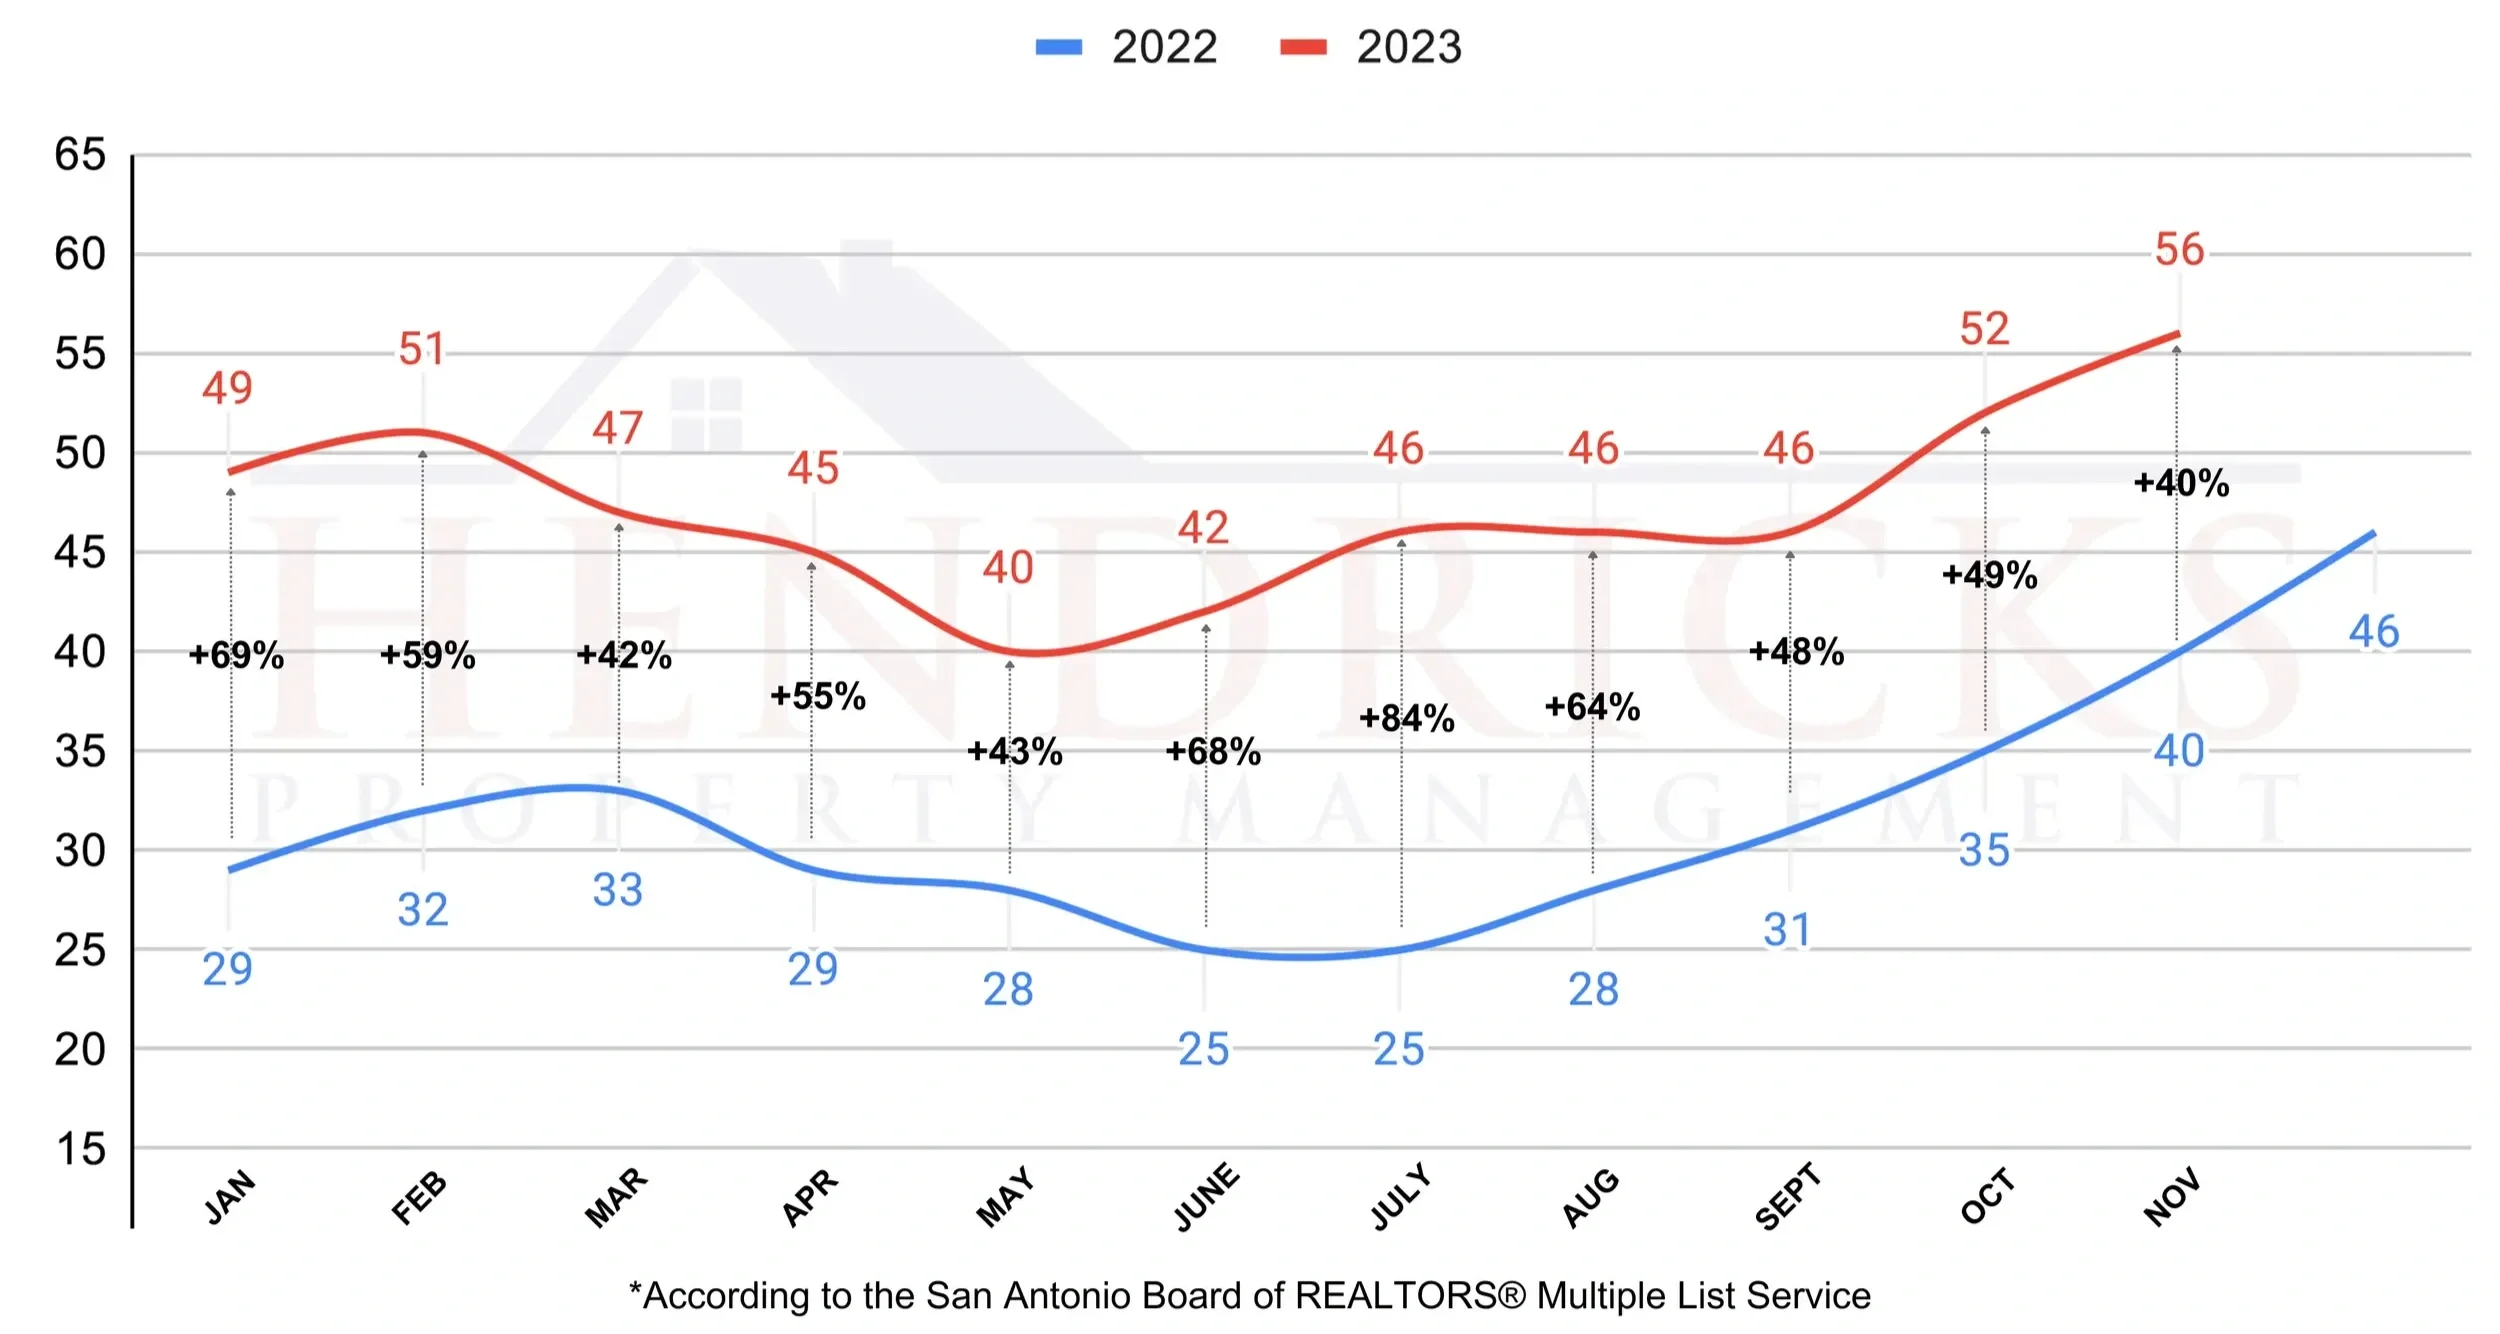
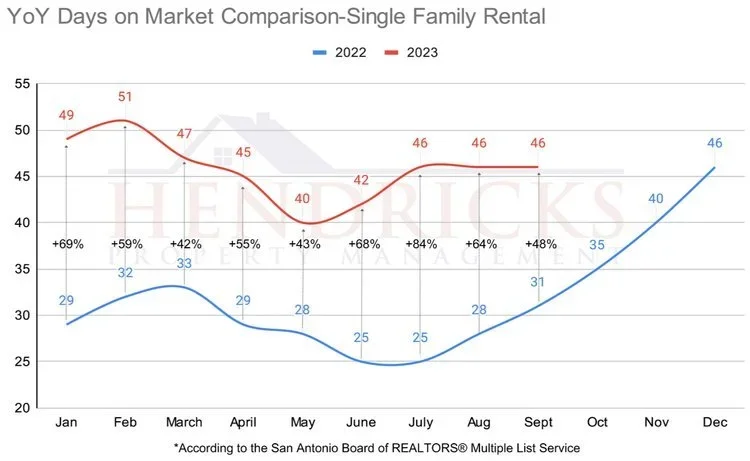
Year over Year Days On Market Comparison for Single Family Rentals
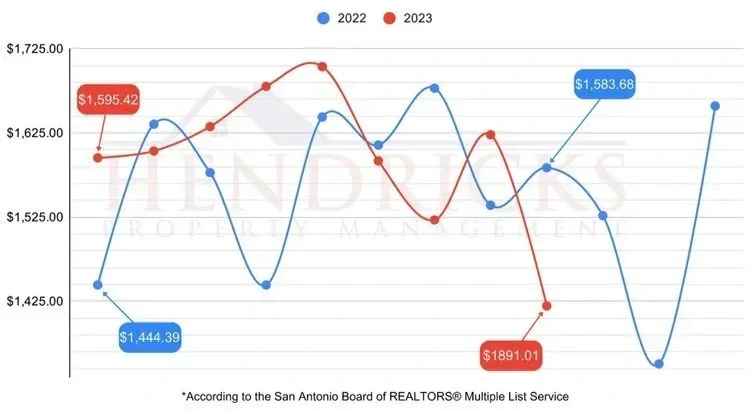
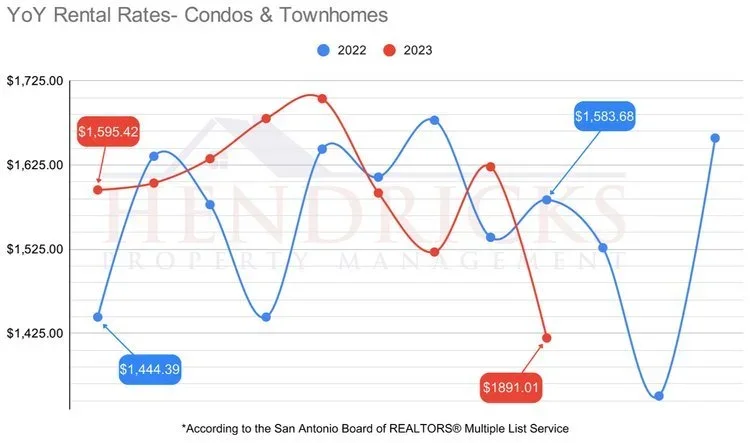
Year over Year Rental Rates for Condos & Townhomes
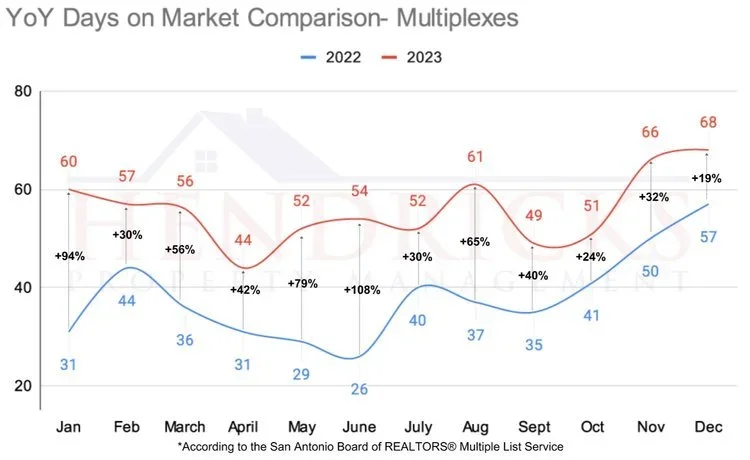
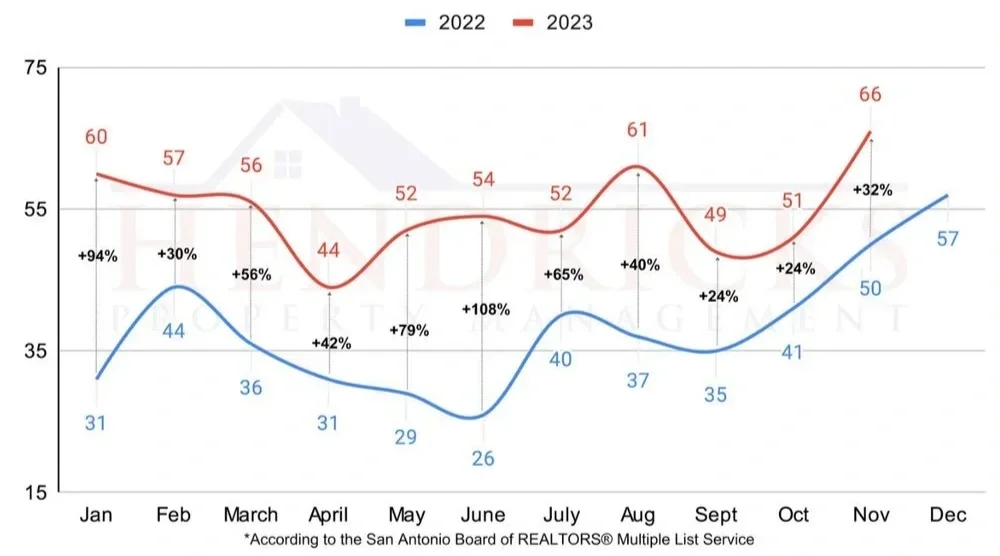
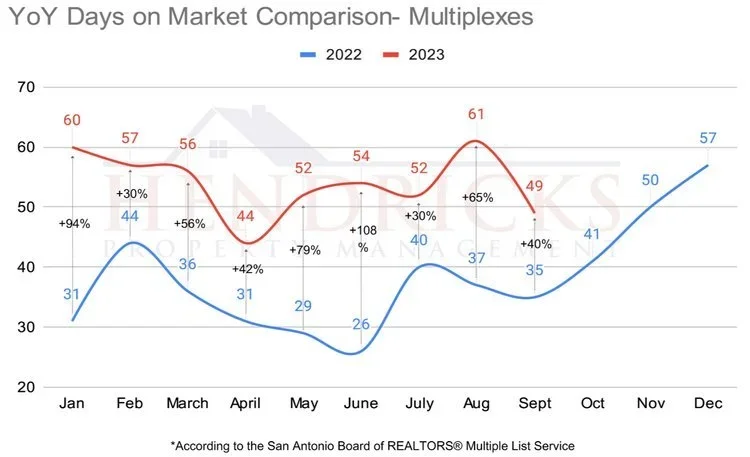
Year over Year Days On Market Comparison for Multiplexes
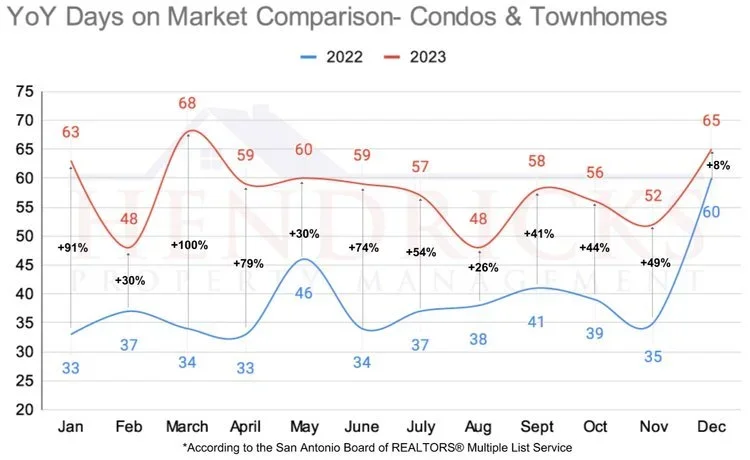
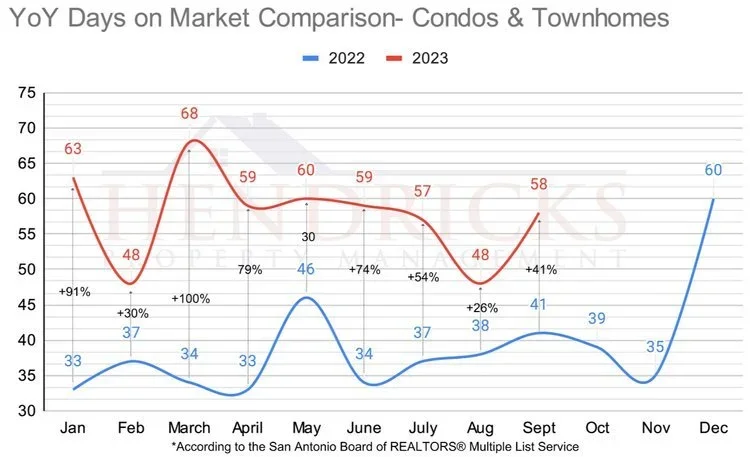
Year over Year Days On Market Comparison for Condos and Townhomes
September 2023 Overall Market Statistics
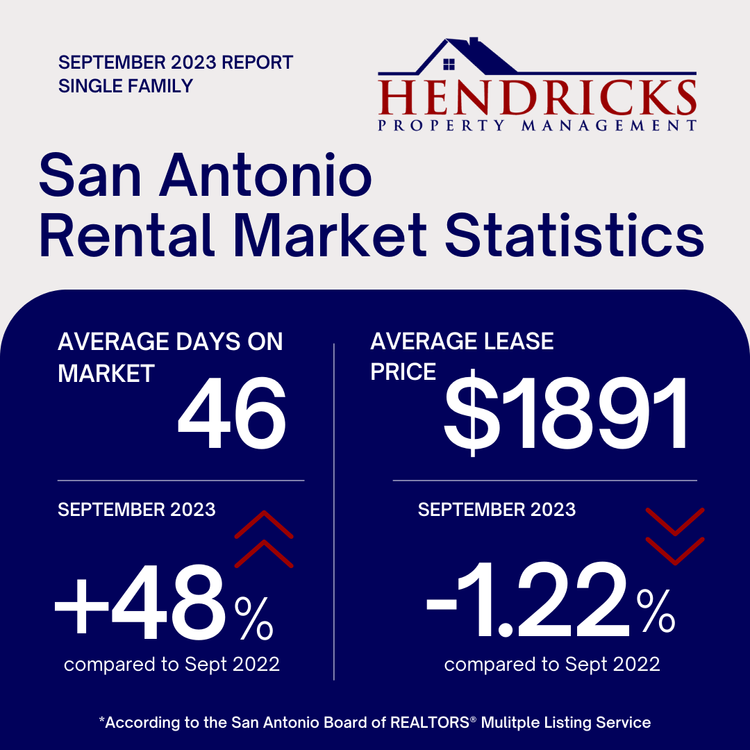
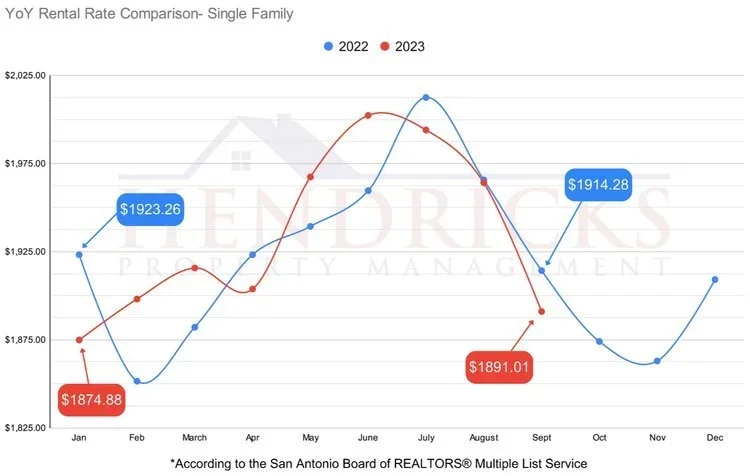
Single family rents averaged $1,891, down from the June peak of about $2,002. Homes took 46 days to rent, versus 31 in September 2022. Inventory reached 3.9 months, tied with October for the high point of 2023.
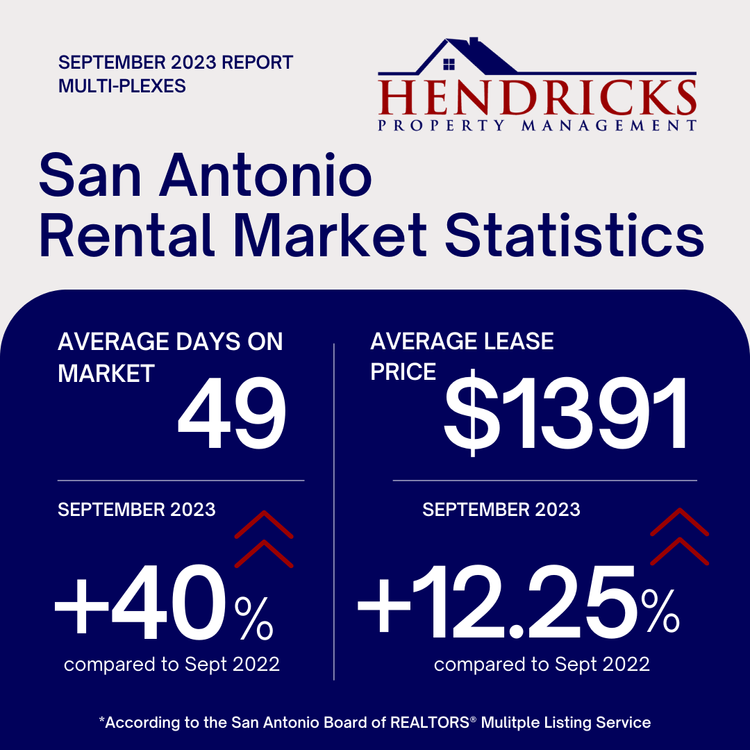
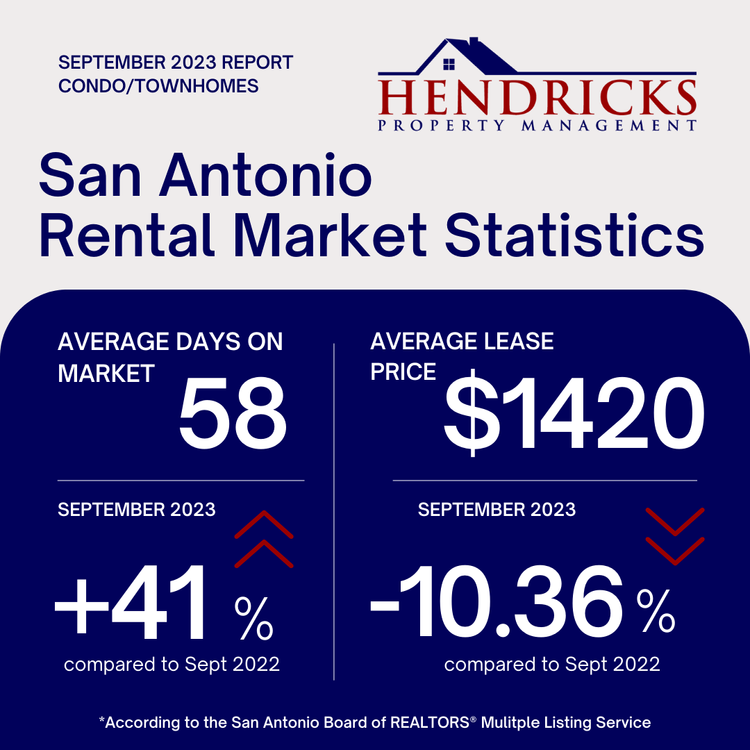
Days on Market for Single Family, Multifamily, and Condos or Townhomes.
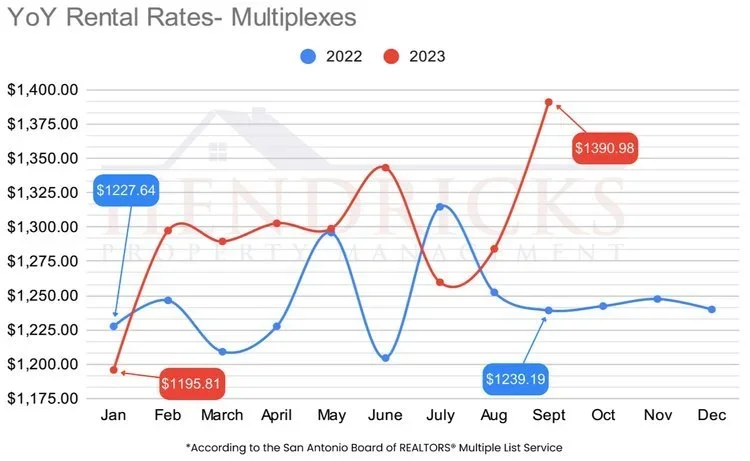
Rental Rates for Single Family, Multifamily, and Condos or Townhomes.
January & February 2023 Market Statistics
Single family rents averaged $1,875 in January and $1,898 in February. But homes were sitting 49 and 51 days, compared to 29 and 32 days a year earlier. Inventory was 3.4 months in January and 3.2 in February.
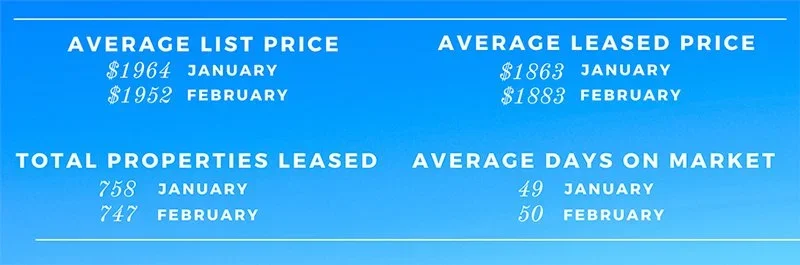
General Market Statistics for for Single Family, Multifamily, and Condos or Townhomes
November & December 2022 San Antonio Rental Market Stats
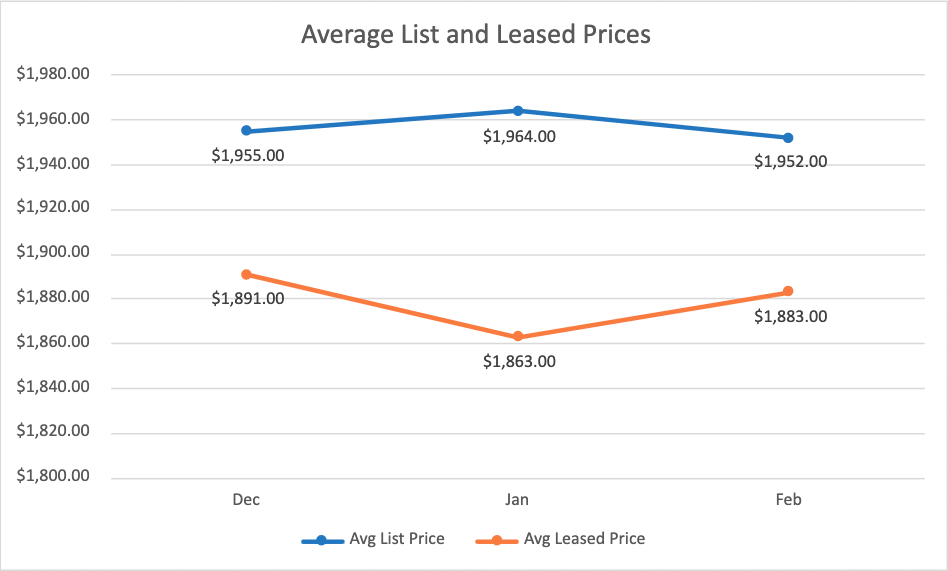
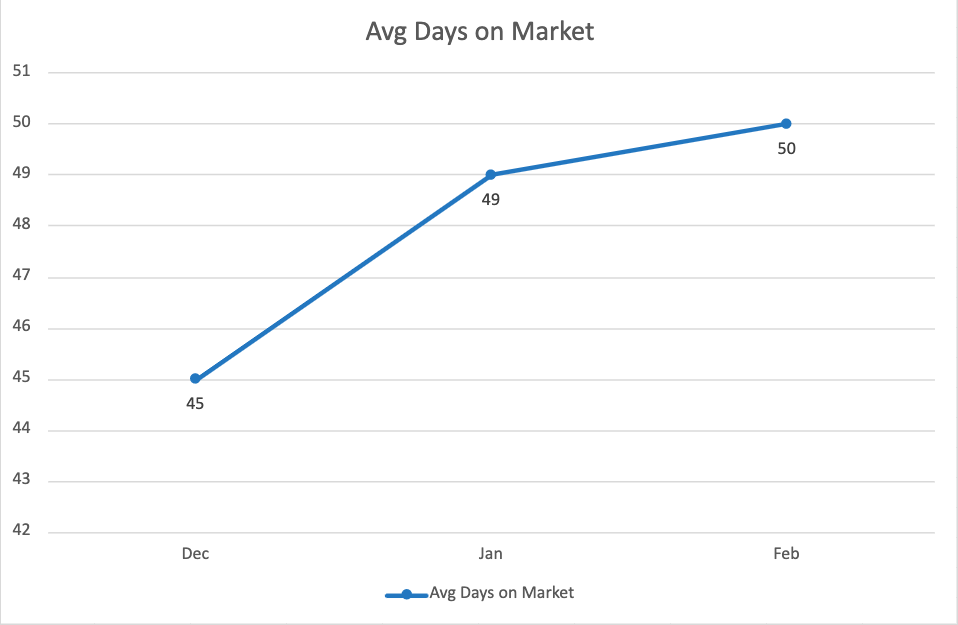
Days on market climbed to 40 in November and 46 in December 2022, as the fast market started to cool. The single family rental rate ended the year at about $1,909.
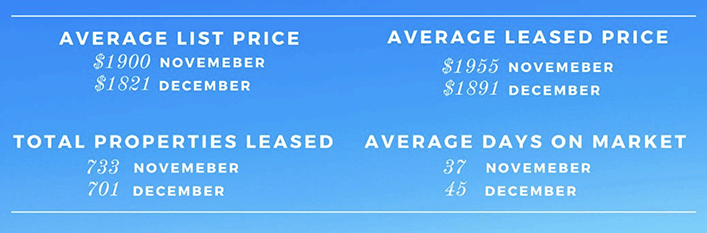
Average List and Leased Prices
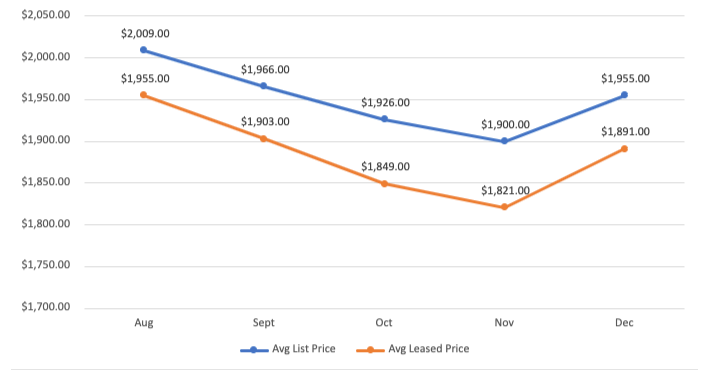
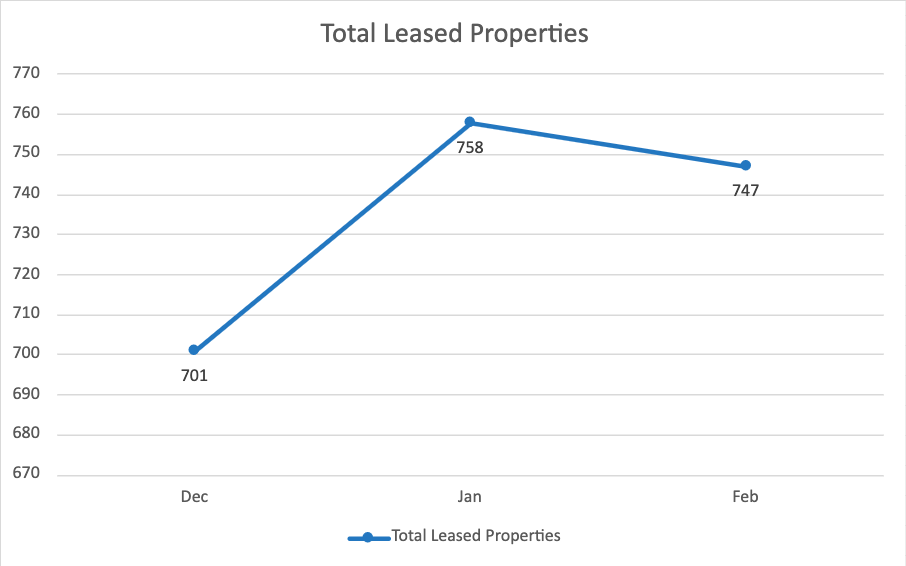
Total Leased Properties
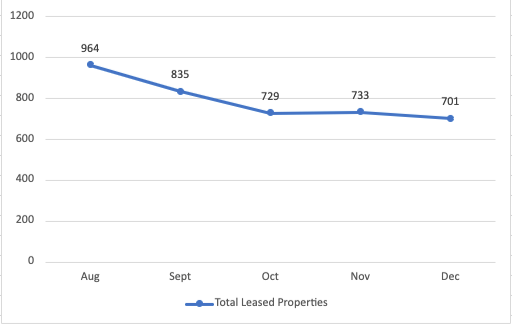
Days on Market for Single Family, Multifamily, and Condos or Townhomes.
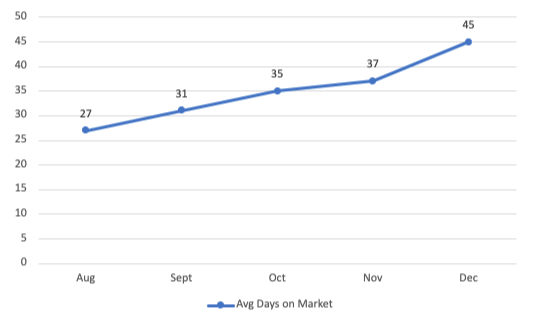
October 2022
In October 2022, the average list price for single family homes in San Antonio was $1,926.00. There were 714 properties leased. The average lease amount was $1,849.00 and the average days on market was 35 days.



September 2022
In September 2022, the average list price was $1966.00. There were 835 total properties leased with an average lease price of $1904.00. The average days on market was 31.

August 2022
In August 2022, the average list price from a single family home in San Antonio, TX was $2009.00. There were a total of 964 properties leased with an average lease price of $1955.00. Average days on market was 28 days.

What These Two Years Meant for Owners
In 2022, most owners could list a home and have it rented in about a month. That changed in 2023. Rents held, but the marketing window got 12 to 21 days longer every single month.
So pricing and timing started to matter a lot more. An owner who priced off a neighbor's 2022 rent in 2023 probably sat longer. That pattern carried into 2024 and 2025.
Frequently Asked Questions
-
Single family rentals averaged about 32 days on market in 2022. June and July were the fastest at 25 days.
-
More homes were available for renters to choose from. Months of inventory moved from as low as 1.8 in mid 2022 to between 2.6 and 3.9 in 2023, so renters had more options and took more time.
-
Not much. Single family rental rates stayed between about $1,866 and $2,002 a month all year, close to 2022 levels.